Loudoun Wildlife Conservancy’s 42 Stream Team and 43 Salt Watch volunteers contributed over 400 hours collecting data about the health of Loudoun’s streams this spring and past winter. That’s a lot of people and a lot of time – but how is this data collected and what does it tell us about the state of our streams? Let’s start with the results of our benthic macroinvertebrate surveys.
Benthic Macroinvertebrate Survey Results
Our monitors use a Virginia Save Our Streams protocol to collect benthic macroinvertebrates that live on the bottom of the stream. These “macros” are mostly different kinds of insect larvae (including dragonflies, beetles, and caddisflies), but also include other creatures like crayfish, clams and worms.
The macros are sorted, identified and tallied before being released back into the stream. Because the macros vary in their sensitivity to pollution, the different types and amounts collected during a survey can be used to determine a stream health score ranging from 0 (unacceptable ecological conditions) to 12 (acceptable ecological conditions).
This spring, our 19 certified stream monitors and assisting volunteers conducted benthic macroinvertebrate surveys at 21 stream sites around the county. Only 38 percent of these sites received acceptable scores, while 52 percent of the sites received unacceptable scores and 10 percent of the sites received indeterminate scores. This shows an overall decrease in stream health from our fall season, when 45 percent of the sites received acceptable scores, 35 percent of the sites received unacceptable scores and 20 percent of the sites received indeterminate scores.
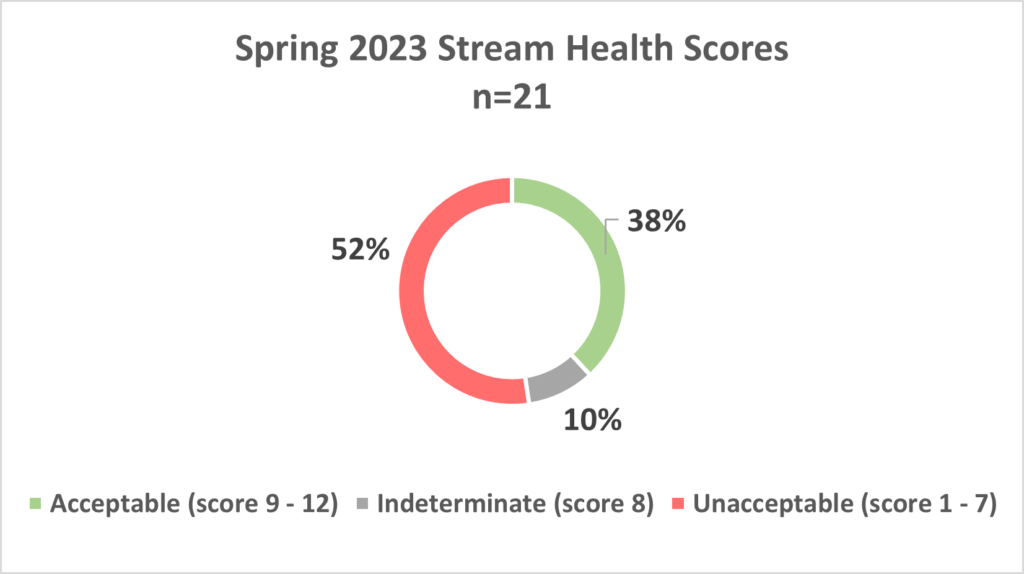
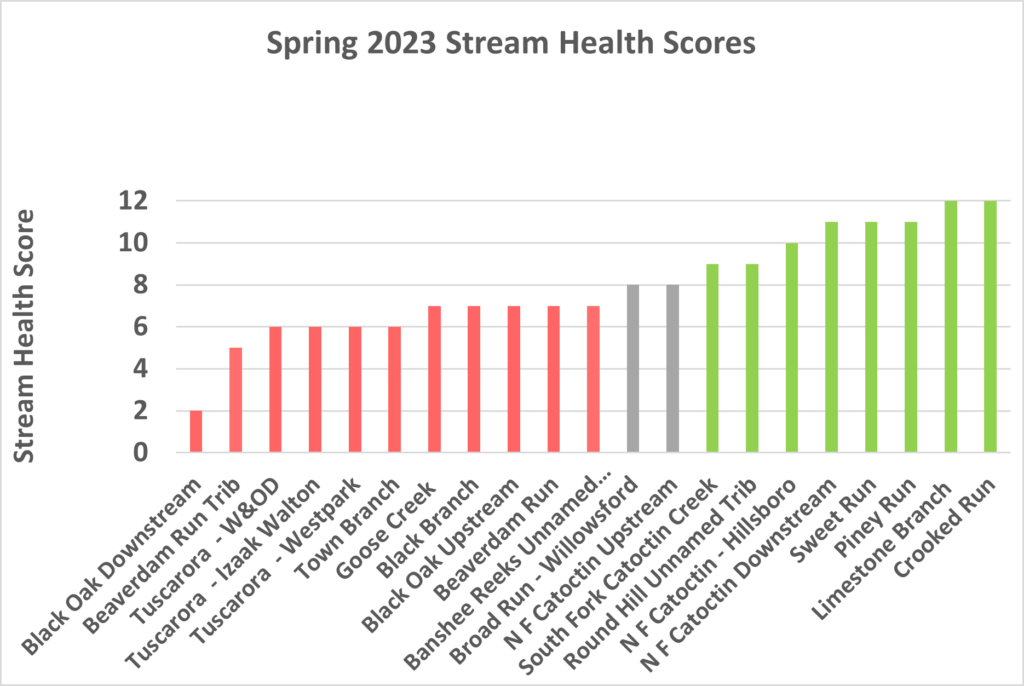
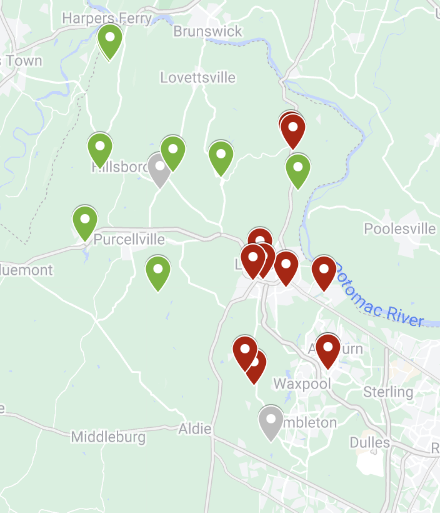 Looking at the stream health scores in relation to their location in the county, it makes sense that most of the streams receiving unacceptable (red) or indeterminate (gray) ratings are located in more suburban or urban areas, whereas the streams receiving acceptable (green) ratings are located in more rural areas.
Suburban and urban areas bring an increase in the number and intensity of threats to stream heath, including nutrient and sediment pollution, chemical pollution (such as road salt), litter and an increase in impervious surfaces. Impervious surfaces, such as roads and rooftops, result in higher storm water runoff and increased sediment and pollution loads.
Salt Watch Results
To have a better understanding of the why behind these stream health scores, we need to conduct additional chemical testing – which is where our Salt Watch volunteers come in! Our Salt Watch volunteers collect data about chloride levels in our local waterways with easy-to-use test strips, which are provided at no charge from our partner organization, the Izaak Walton League of America.
Chlorides come from road salt or brine applied to our roadways, sidewalks and parking lots in the winter – which later end up in our streams. While road salt keeps us safe on icy roads and sidewalks, it can also pose a threat to fish and other aquatic life in freshwater streams, as they can’t survive in salty water.
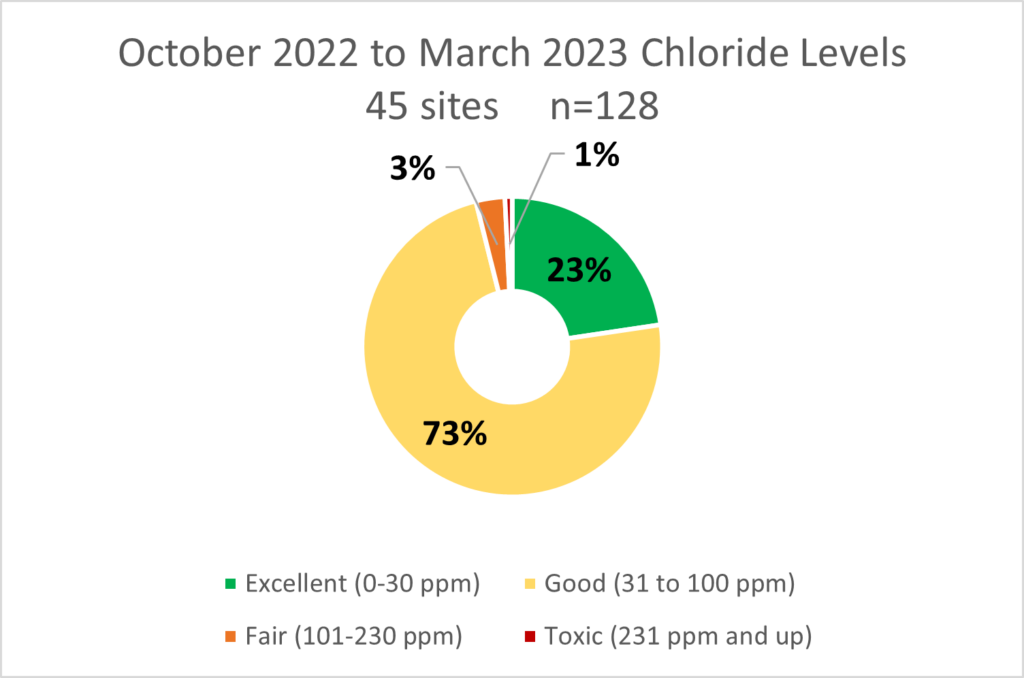
Between October 2022 and March 2023, our team of 43 Salt Watch volunteers collected 128 data points for winter salt pollution from 45 stream sites located on 13 streams around the county – from Bluemont in the west to Sterling in the east, and Neersville in the north to Aldie in the south. Our Salt Watchers tested chloride levels in local streams before and after winter weather events involving road treatments, as well as initial baseline testing in the fall.
This past winter was much milder than the prior winter, which meant that less salt and brine were applied to the roadways, and that less chloride ended up in our streams. This is apparent in the data that our Salt Watchers collected over both seasons.
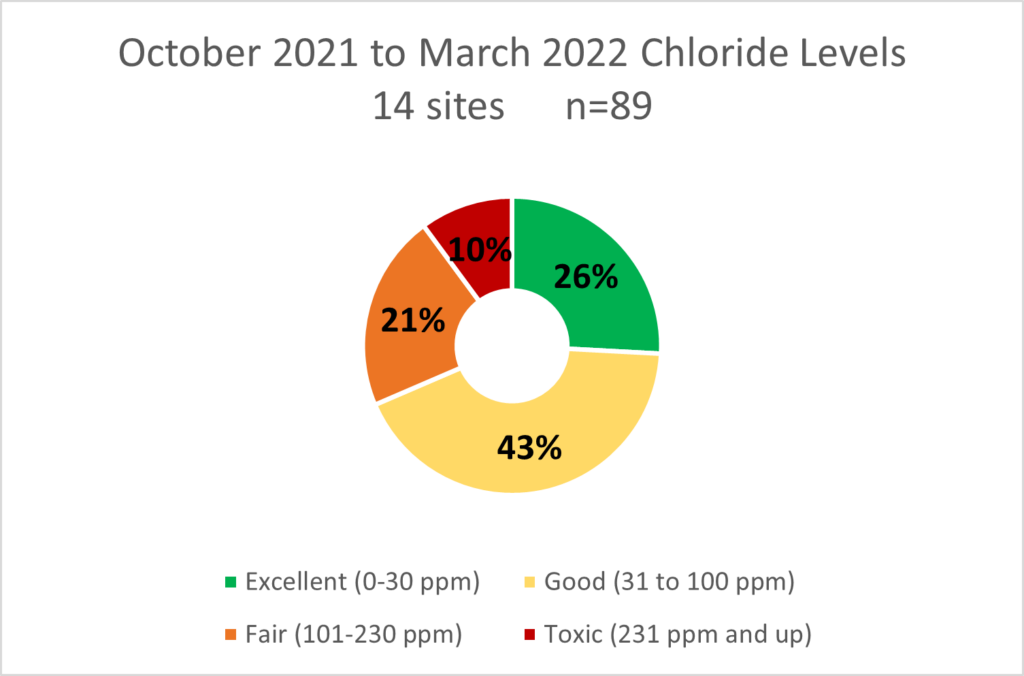
This winter, the results for only 3 percent of the chloride tests indicated “Fair” chloride levels and only 1 percent of the results had “Toxic” levels, which were much lower than the results of the prior winter with 21 percent of the tests having “Fair” chloride levels and 10 percent of the results indicating “Toxic” levels.
The Bigger Picture – Adding Chemical Monitoring
If the salt levels were lower this past winter, why did we see an overall decline in stream health scores this spring? Because salt pollution is only one contributing factor to the degradation of stream health. Overall water quality is also determined by factors such as the amount of dissolved oxygen in the water, water temperature (colder water has higher dissolved oxygen and can sustain a larger diversity of life), pH, and water clarity (which is related to sediment and nutrient pollution).
To have a better understanding of why we are seeing different ecological conditions at our stream sites, it’s best to incorporate the data from our benthic macroinvertebrate surveys and Salt Watch tests with other chemical and physical data, including dissolved oxygen, temperature, pH and water clarity.
To that end, our Stream Team is partnering with the Alliance for the Chesapeake Bay’s RiverTrends program. RiverTrends will provide us with the training, equipment, and technical support needed to conduct chemical and physical water quality monitoring at some of our macro survey sites. RiverTrends will train five of our Stream Team monitors in August, and we hope to start collecting additional data later that month.

